In this exercise, you use the Total Cost of Ownership (TCO) Calculator to compare the cost of running a sample workload in your datacenter versus on Azure.
Assume you’re considering moving some of your on-premises workloads to the cloud.
But first, you need to understand more about moving from a relatively fixed cost structure to an ongoing monthly cost structure.
You’ll need to investigate whether there are any potential cost savings in moving your datacenter to the cloud over the next three years. You need to take into account all of the potentially hidden costs involved with operating on-premises and in the cloud.
Instead of manually collecting everything you think might be included, you use the TCO Calculator as a starting point.
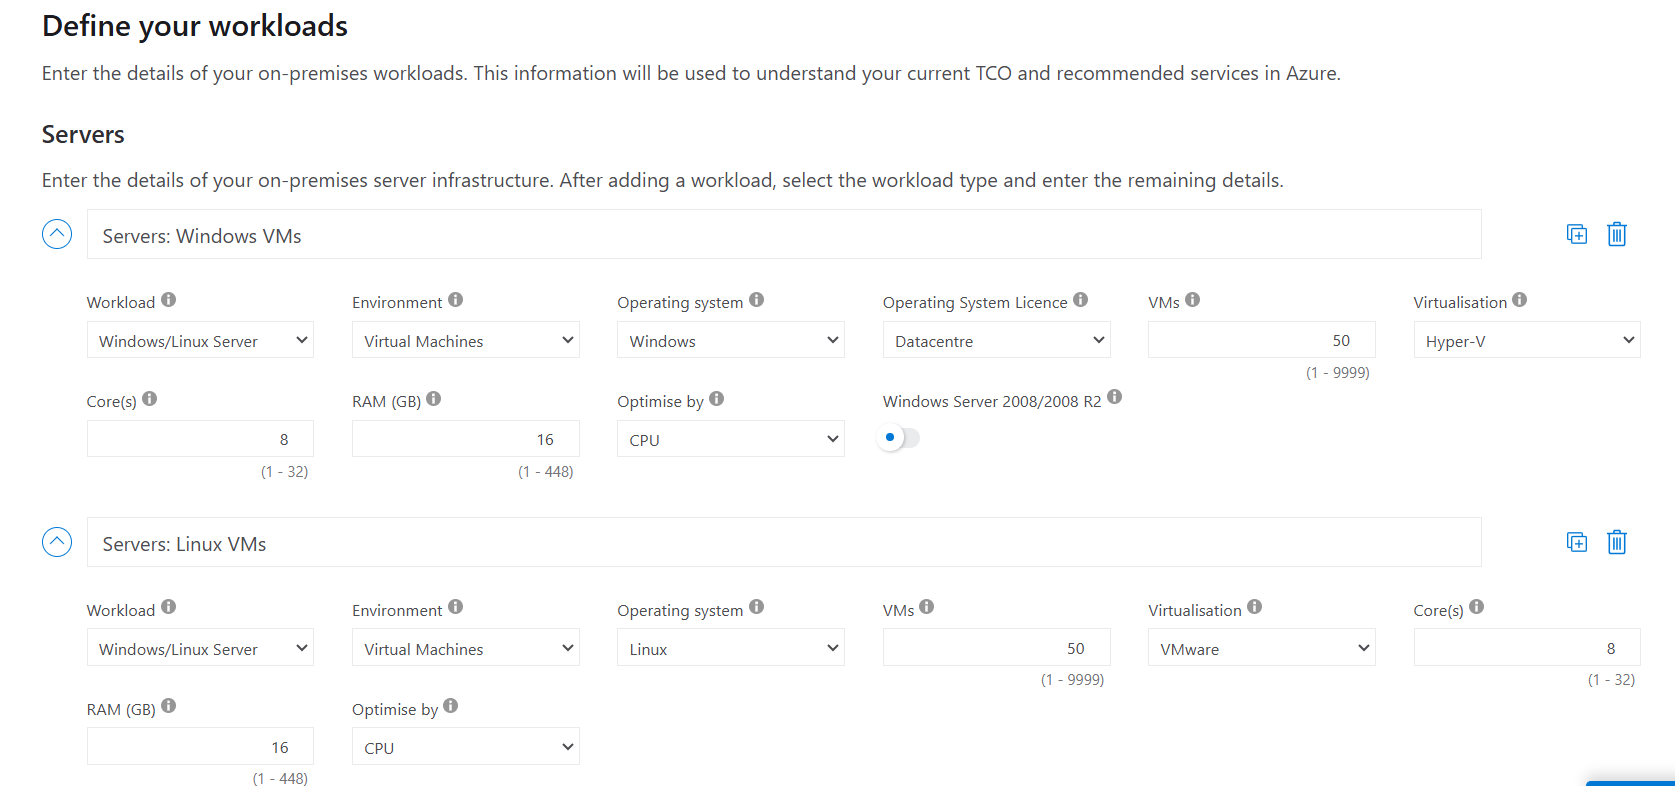
Let’s say that:
- You run two sets, or banks, of 50 virtual machines (VMs) in each bank.
- The first bank of VMs runs Windows Server under Hyper-V virtualization.
- The second bank of VMs runs Linux under VMware virtualization.
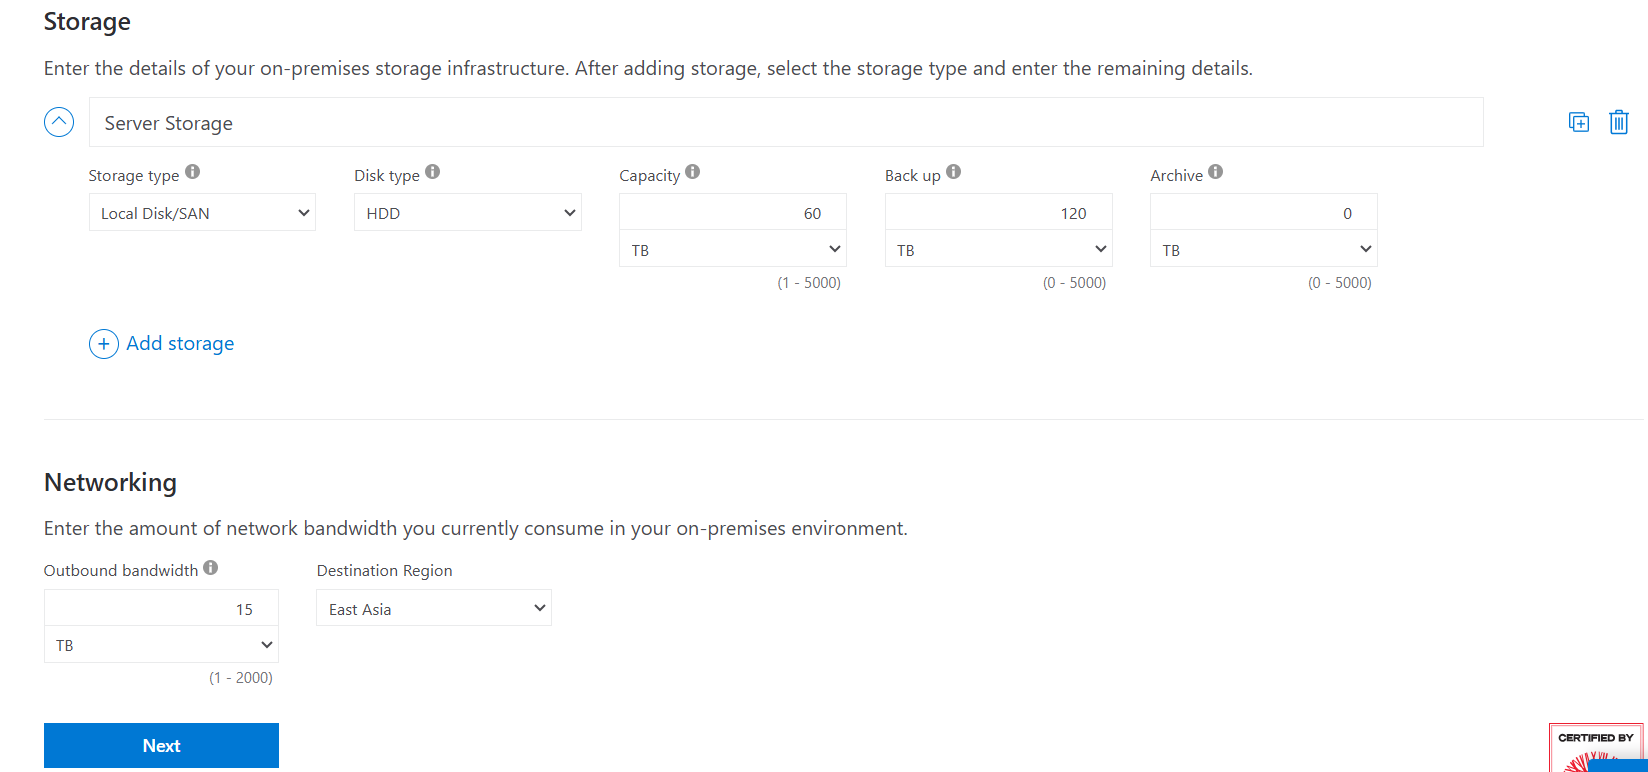
- There’s also a storage area network (SAN) with 60 TB of disk storage.
- You consume an estimated 15 TB of outbound network bandwidth each month.
- There are also a number of databases involved, but for now, you’ll omit those details.
TCO Calculator involves 3 steps:
Define your workloads
Go to the TCO Calculator
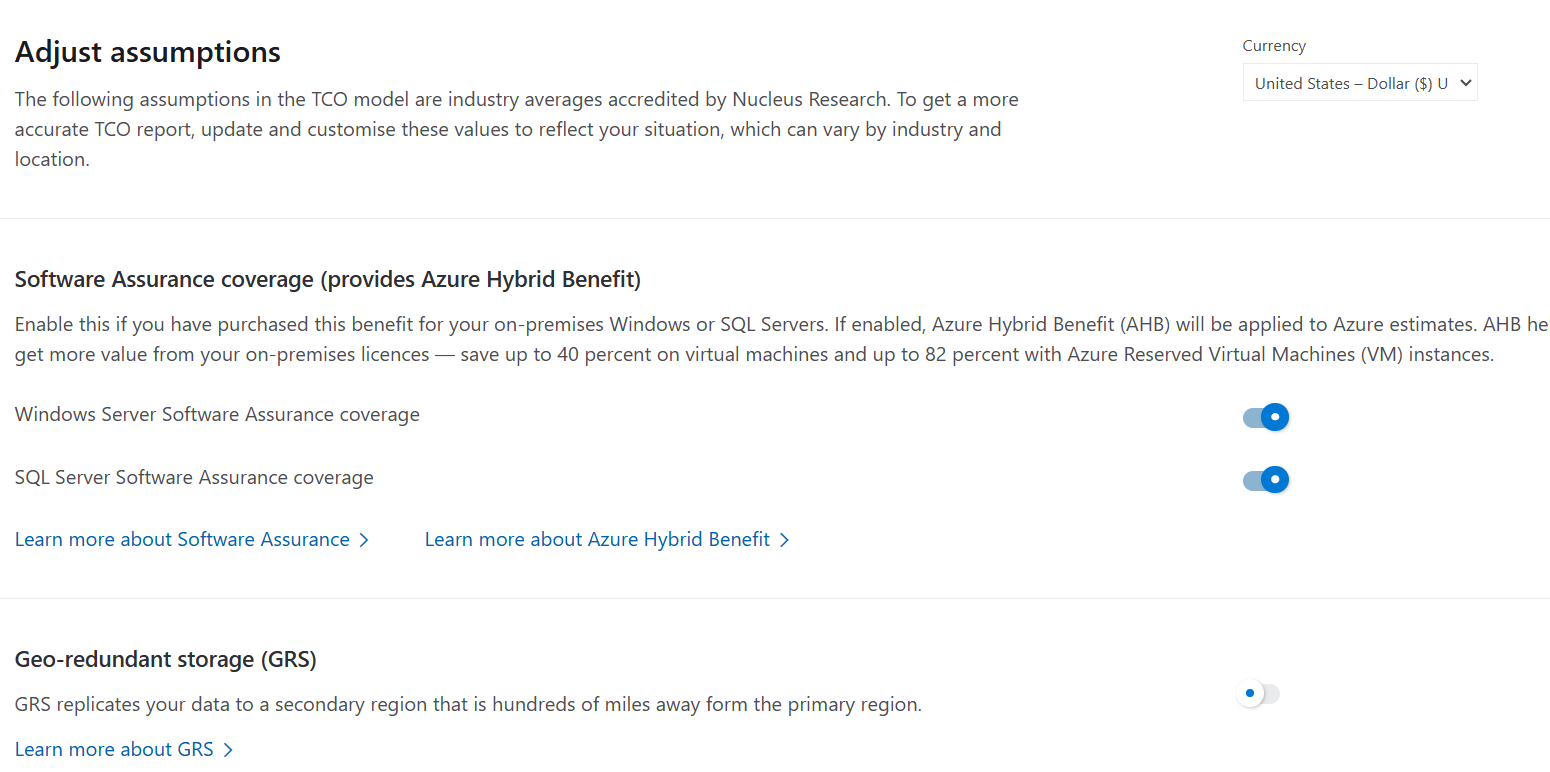
Adjust assumptions
Here, you specify your currency. For brevity, you leave the remaining fields at their default values.
In practice, you would adjust any cost assumptions and make any adjustments to match your current on-premises environment.
- At the top of the page, select your currency. This example uses US Dollar ($).
- Select Next.
View the report
Remember, you’ve been tasked to investigate cost savings for your European datacenter over the next three years.
To make these adjustments:
- Set Timeframe to 3 Years.
- Set Region to North Europe.

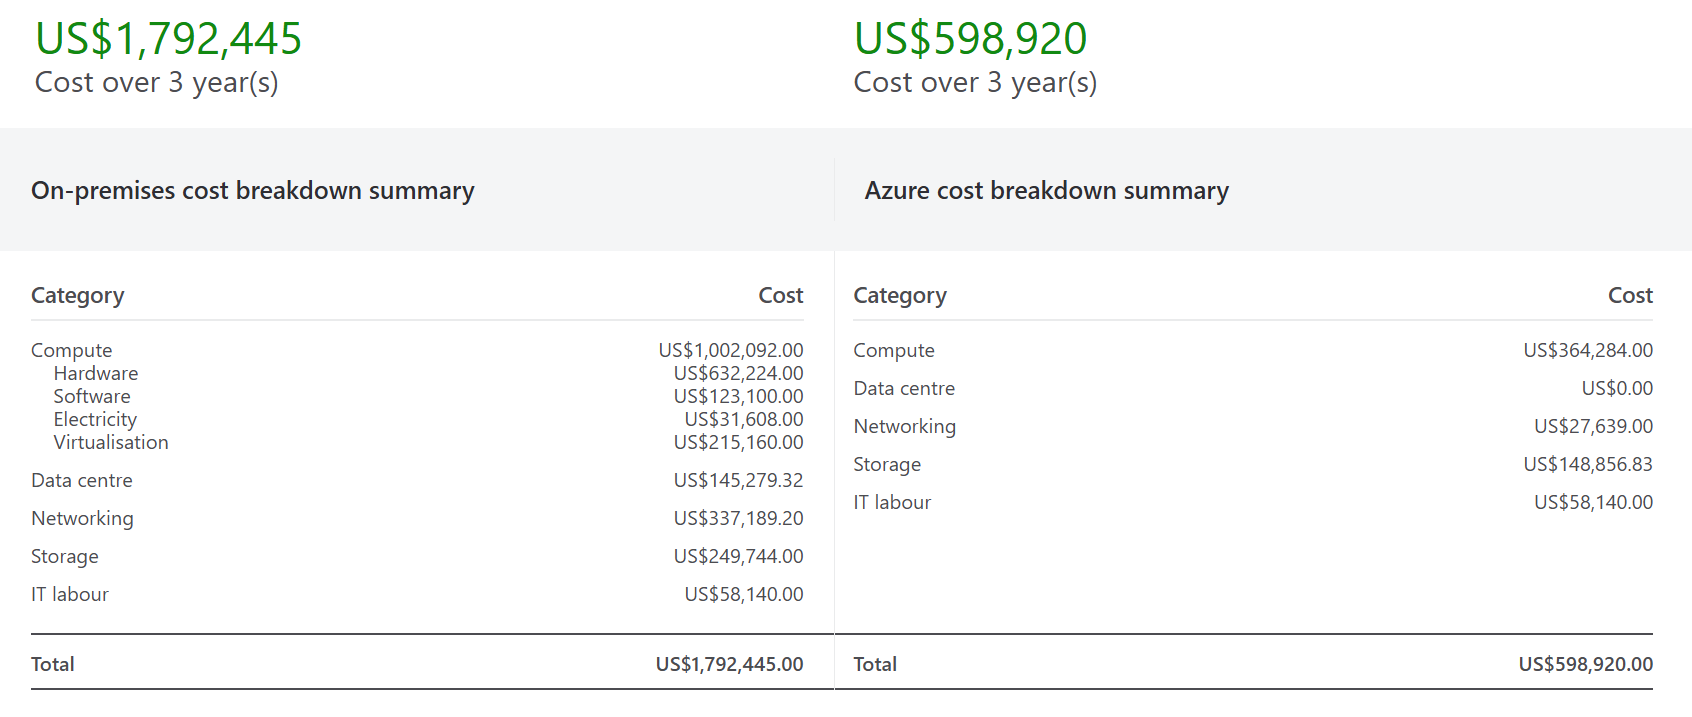
Scroll to the summary at the bottom. You see a comparison of running your workloads in the datacenter versus on Azure.
Select Download to download or print a copy of the report in PDF format.
Done !!!