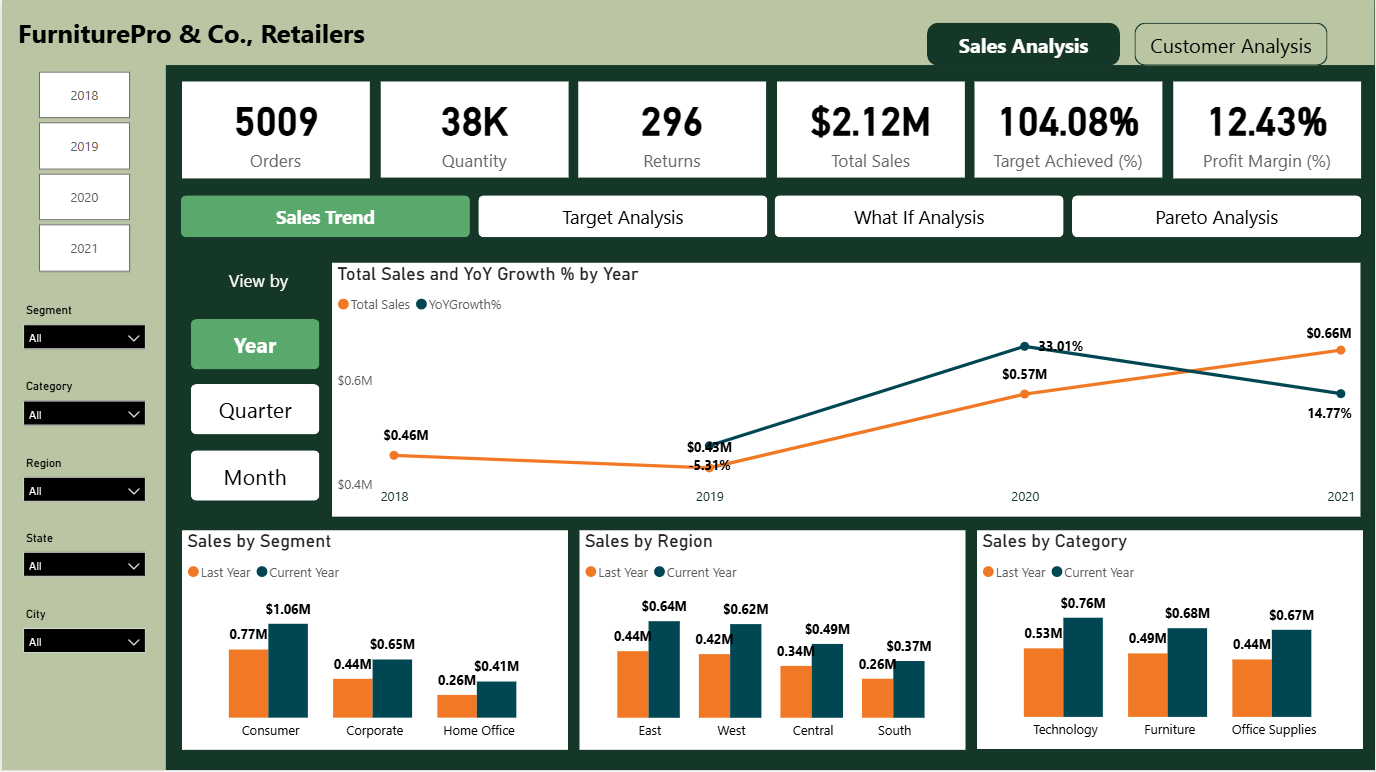
Furniture Pro & Co., Retailers - Power BI Case Study
Built a Power BI report analyzing sales, RFM segments, and customer behavior. Uncovered that 20% of customers drive 49% of sales. Identified high returns in Office Supplies and weak new customer acquisition. Provided growth and retention strategies.
Tools:Power BI
Techniques:Data VisualizationDesign
Industries:RetailAnalytics
Danny's Diner SQL Case Study
Analyzed customer behavior and sales for a Japanese diner using PostgreSQL. Tackled real-world questions with CTEs and subqueries. Revealed purchase patterns and visit frequency. A hands-on SQL storytelling challenge.
Tools:PostgreSQL
Techniques:CTEsSubqueries
Industries:RestaurantRetail
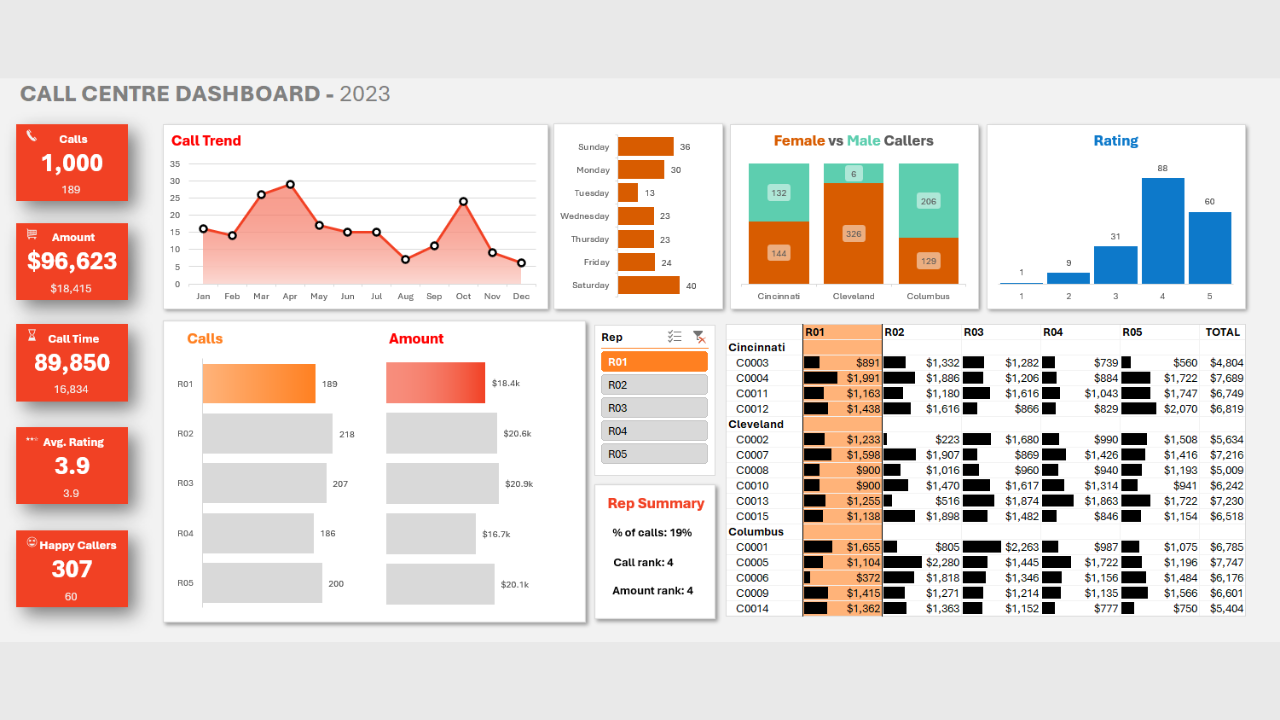
Call Centre Excel Dashboard
Designed an interactive Excel dashboard using pivot tables, charts, and slicers. Tracked key metrics like call time, volume, and amount. Improved visibility into performance trends. Strengthened my Excel visualization skills.
Tools:Excel
Techniques:Pivot TablesPivot Charts
Industries:Call CentreCustomer Service
Clique Bait SQL Case Study
Used SQL to evaluate ad performance and user behavior for an online seafood store. Found a 23% lift in purchases from ad engagement. Identified top campaigns and provided optimization strategies. A marketing-focused analytics project.
Tools:MySQL
Techniques:CTEsSubqueries
Industries:E-commerceRetail
HR Insights at Salifort Motors
Analyzed HR data to understand attrition drivers at Salifort Motors. Used EDA and ML (Random Forest, Decision Tree) for prediction. Achieved 96.2% accuracy, 93.8% AUC. Delivered actionable retention insights.
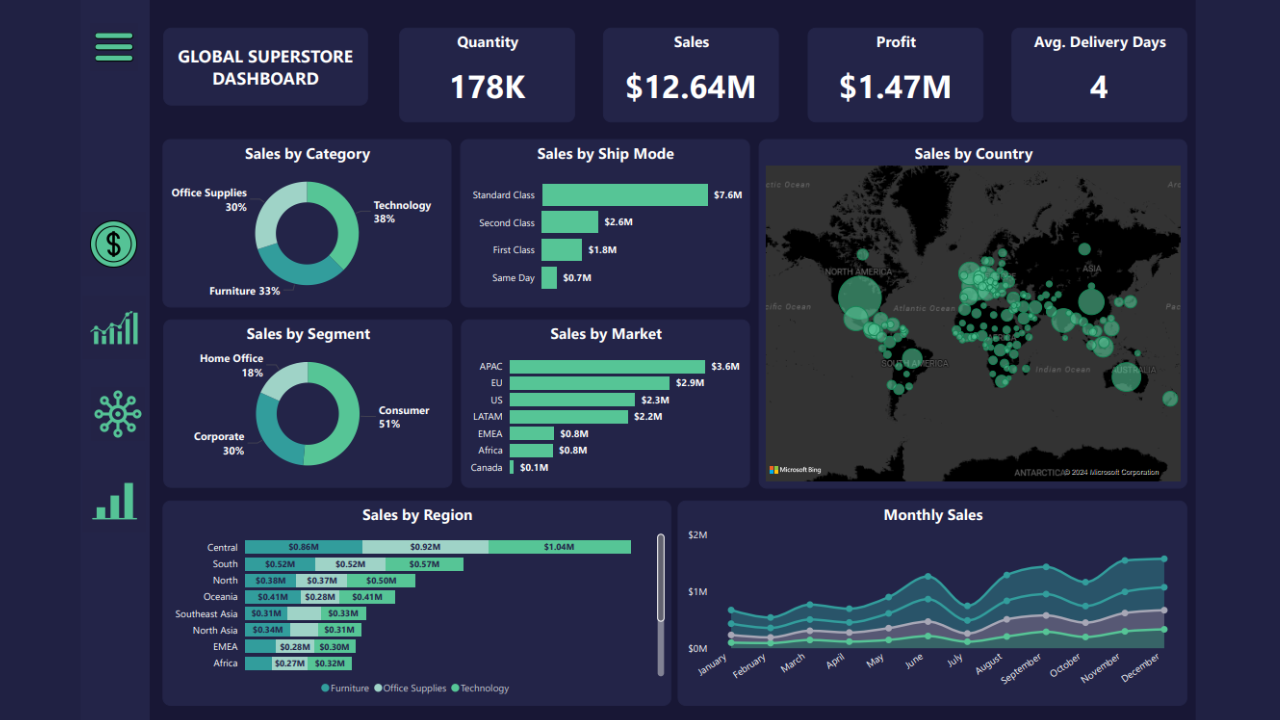
Built a Power BI dashboard to analyze global sales by region, category, and time. Included dynamic filters, forecasts, and decomposition trees. Enabled trend discovery and strategic comparison. Showcases business storytelling.
Tools:Power BI
Techniques:Data VisualizationDesign
Industries:RetailSales
Power BI Pokedex
Created a Power BI dashboard inspired by Pokémon's Pokedex. Integrated external data to build interactive profiles and visuals. Designed a fun, game-style user experience. Showcases Power BI’s creative potential.
Tools:Power BI
Techniques:Data VisualizationDesign
Industries:EntertainmentGames
Walmart Sales Analysis
Explored Walmart transaction data to uncover sales trends, top products, and customer segments. Highlighted category performance and optimization areas. Used SQL CTEs for efficient querying. A practical retail analytics project.
Tools:MySQL
Techniques:CTEs
Industries:RetailSales
Student Performance Prediction
Predicted student academic outcomes using demographic and educational data. Applied EDA, preprocessing, and classification models. Helped identify at-risk students early. Supports education-focused interventions.
Tools:Pythonscikit-learn
Techniques:EDAMachine Learning
Industries:Education
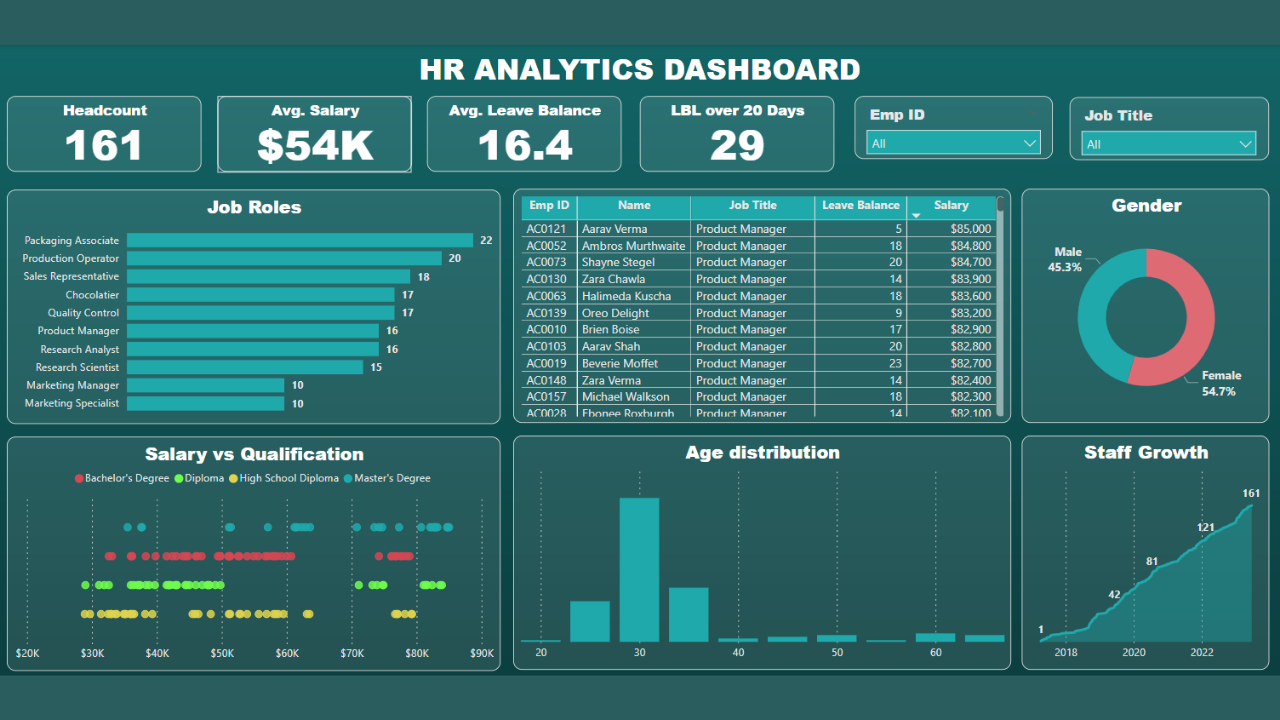
HR Analytics Dashboard
Built a Power BI dashboard to visualize headcount, salaries, leave data, and demographics. Used DAX and Power Query for dynamic insights. Supports strategic HR decisions through clear, interactive visuals.