
I started learning Power Apps, and this is my first canvas app.
Check out this post on Medium
Contoso Site Tracking Canvas App
Data source is an Excel file with below details, images are stored in a separate folder:
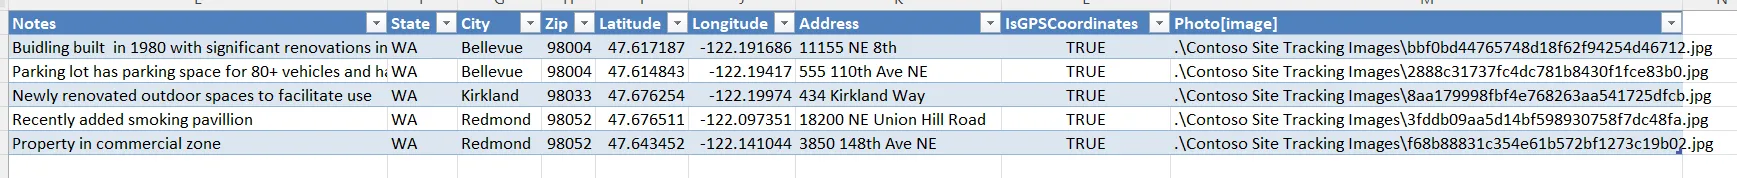 Table in the Excel file
This excel file and image folder are in OneDrive.
Go to power apps and click create.
- In the Start from data section, select Excel.
- Under Connections, choose OneDrive. If you don’t have the connection available, select New connection to create one.
- For Choose an Excel file on the right select the Contoso Site Tracking.xlsx file.
- For Choose a table select SiteInspector (this is the table name in excel for this data) and select Connect.
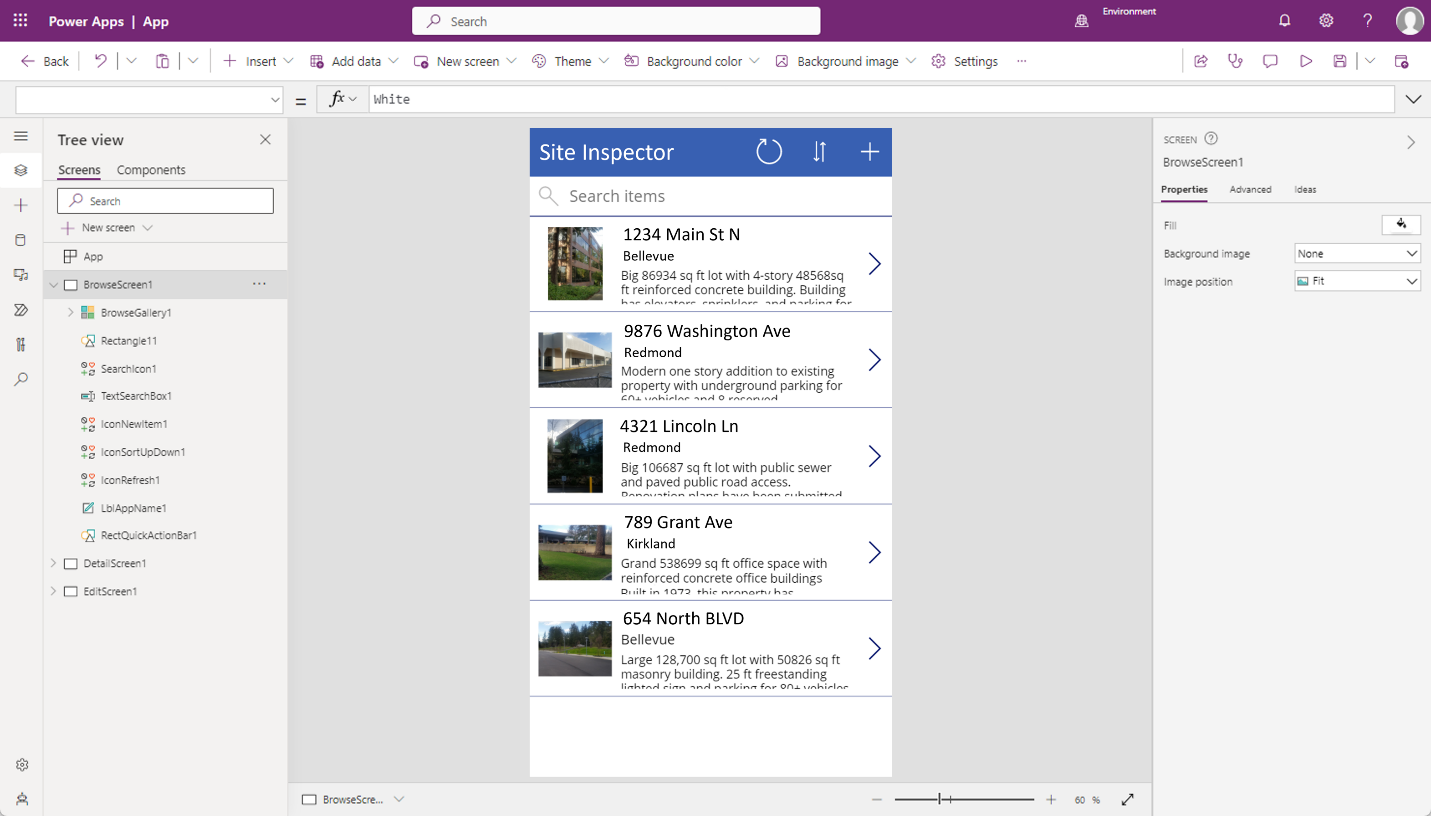
Power Apps generates the App with this data.
Explore the App
This creates 3 screens in our app
Browse screen — This screen appears by default. In it, you can browse, sort, search, and refresh the data from the data source. You can even add items to the data source by selecting the plus sign.
Details screen — The details screen shows all the information about a single item. In this screen, you can open an item to edit or delete it.
Edit/create screen — you can edit an existing item or create a new one.
This is Power Apps Studio with our app
Controls in Power Apps
A control is an UI element that produces an action or shows information.
Controls include -> labels, text-input boxes, drop-down lists, navigation elements, and so on.
Insert tab gives access to all controls we can create.
Common Controls:
- Galleries — layout containers that hold a set of controls that show rows from a data source. Used when you want to display multiple records.
- Forms — show details about your data and let you create and edit records.
- Media — add background images, a camera button, a barcode reader, and more.
- Charts — add charts for instant analysis